U.S. Handle Down, Purses Up in Third Quarter
Image:
Description:

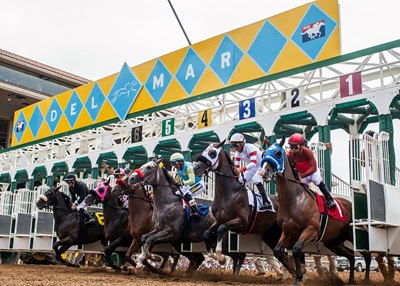
Photo: Benoit Photo
The summer racing season economic indicators saw a decline in wagering on United States races, although purses on those events increased, according to figures released Oct. 4 by Equibase.
Wagering in the third quarter, July-September, declined 1.89% compared with the third quarter of 2018 to $2.9 billion. However, purses increased 4.85% to $349.8 billion.
Wagering was affected by a 10.9% decline in all-sources handle at the Del Mar summer meeting. That meet in Southern California followed a Santa Anita Park winter-spring meeting plagued by catastrophic breakdowns. The summer season's other important meeting, Saratoga Race Course, saw wagering improve more than 7% to $705.3 million.
The quarterly trends match the trends through the first nine months of the year. Despite a slight gain in race days, wagering is off 2.78% to about $8.6 billion. Purses are up more than 5% to $893.8 million.
|
Thoroughbred Racing Economic Indicators
|
|||
|
For September/3rd Quarter 2019
|
|||
|
September 2019 vs. September 2018 |
|||
|
Indicator |
September 2019 |
September 2018 |
% Change |
|
Wagering on U.S. Races* |
$801,551,539 |
$854,530,359 |
-6.20% |
|
U.S. Purses |
$118,180,799 |
$116,276,050 |
+1.64% |
|
U.S. Race Days |
412 |
424 |
-2.83% |
|
U.S. Races |
3,328 |
3,472 |
-4.15% |
|
U.S. Starts |
25,221 |
26,170 |
-3.63% |
|
Average Field Size |
7.58 |
7.54 |
+0.54% |
|
Average Wagering Per Race Day |
$1,945,513 |
$2,015,402 |
-3.47% |
|
Average Purses Per Race Day |
$286,847 |
$274,236 |
+4.60% |
|
3rd QTR 2019 vs. 3rd QTR 2018 |
|||
|
Indicator |
3rd QTR 2019 |
3rd QTR 2018 |
% Change |
|
Wagering on U.S. Races* |
$2,920,690,510 |
$2,977,017,173 |
-1.89% |
|
U.S. Purses |
$349,816,903 |
$333,625,982 |
+4.85% |
|
U.S. Race Days |
1,411 |
1,415 |
-0.28% |
|
U.S. Races |
11,096 |
11,257 |
-1.43% |
|
U.S. Starts |
80,728 |
83,144 |
-2.91% |
|
Average Field Size |
7.28 |
7.39 |
-1.50% |
|
Average Wagering Per Race Day |
$2,069,944 |
$2,103,899 |
-1.61% |
|
Average Purses Per Race Day |
$247,921 |
$235,778 |
+5.15% |
|
YTD 2019 vs. YTD 2018 |
|||
|
Indicator |
YTD 2019 |
YTD 2018 |
% Change |
|
Wagering on U.S. Races* |
$8,596,390,581 |
$8,841,839,027 |
-2.78% |
|
U.S. Purses |
$893,820,785 |
$849,196,602 |
+5.25% |
|
U.S. Race Days |
3,515 |
3,496 |
+0.54% |
|
U.S. Races |
28,553 |
28,653 |
-0.35% |
|
U.S. Starts |
210,967 |
215,890 |
-2.28% |
|
Average Field Size |
7.39 |
7.53 |
-1.94% |
|
Average Wagering Per Race Day |
$2,445,630 |
$2,529,130 |
-3.30% |
|
Average Purses Per Race Day |
$254,288 |
$242,905 |
+4.69% |
| * Includes worldwide commingled wagering on U.S. races. | |||