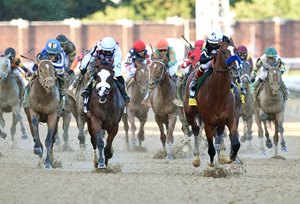
Kentucky Derby Provides Boost for Third Quarter Handle


With the Kentucky Derby Presented by Woodford Reserve (G1) moved from the first Saturday in May to the first Saturday in September this year, wagering on United States races for the month and third quarter enjoyed a boost compared with 2019.
The year's biggest day of race wagering in the U.S. was moved because of the COVID-19 pandemic. Even though its $126 million in wagering was about half of the wagering total of the 2019 Derby Day, it provided a welcome highlight Sept. 5 at Churchill Downs.
With tracks racing without fans or very limited attendance, racing continued to find a way in a challenging year. Saratoga Race Course topped $700 million in handle for a second straight year, nearly matching the 2019 record handle of $705.3 million.
The summer's other big meet, Del Mar, enjoyed an 8% bump in wagering to $466.7 million despite offering 25% fewer race days this year.
That has been a key to success for U.S. racing in 2020: Fans have supported the available product. Despite a 28.6% reduction in race days to 2,509 so far this year, total wagering is off just 2.9% to $8,348,815,108. Average wagering per race day is up 36.1% to $3,327,547, in part because field size is up 6.5% to 7.87 starters per race.
Still, with nearly all of the money being wagered going through advance-deposit wagering outlets, the industry figures to face some challenges as those outlets return a smaller percentage of the wagering dollar to race purses when compared with on-track wagering (live or simulcast).
Purses offered at U.S. tracks this year are down 29.6% to $629,176,645, most of which can be attributed to the losses in race days and races. Total races are down 26.8% to 20,895. Average purses per race day are off just 1.4% to $250,768.
For September/Third Quarter 2020
| September 2020 vs. September 2019 | |||
| Indicator | September 2020 | September 2019 | % Change |
| Wagering on U.S. Races* | $1,039,737,336 | $801,998,134 | 29.64% |
| U.S. Purses | $110,251,841 | $118,229,293 | -6.75% |
| U.S. Race Days | 365 | 412 | -11.41% |
| U.S. Races | 3,101 | 3,329 | -6.85% |
| U.S. Starts | 24,447 | 25,231 | -3.11% |
| Average Field Size | 7.88 | 7.58 | 4.02% |
| Average Wagering Per Race Day | $2,848,595 | $1,946,597 | 46.34% |
| Average Purses Per Race Day | $302,060 | $286,964 | 5.26% |
| 3rd QTR 2020 vs. 3rd QTR 2019 | |||
| Indicator | 3rd QTR 2020 | 3rd QTR 2019 | % Change |
| Wagering on U.S. Races* | $3,293,292,589 | $2,921,407,748 | 12.73% |
| U.S. Purses | $305,013,587 | $349,865,237 | -12.82% |
| U.S. Race Days | 1,208 | 1,411 | -14.39% |
| U.S. Races | 9,989 | 11,097 | -9.98% |
| U.S. Starts | 76,402 | 80,738 | -5.37% |
| Average Field Size | 7.65 | 7.28 | 5.13% |
| Average Wagering Per Race Day | $2,726,236 | $2,070,452 | 31.67% |
| Average Purses Per Race Day | $252,495 | $247,956 | 1.83% |
| YTD 2020 vs. YTD 2019 | |||
| Indicator | YTD 2020 | YTD 2019 | % Change |
| Wagering on U.S. Races* | $8,348,815,108 | $8,594,182,019 | -2.86% |
| U.S. Purses | $629,176,645 | $893,867,369 | -29.61% |
| U.S. Race Days | 2,509 | 3,515 | -28.62% |
| U.S. Races | 20,895 | 28,554 | -26.82% |
| U.S. Starts | 164,476 | 210,977 | -22.04% |
| Average Field Size | 7.87 | 7.39 | 6.53% |
| Average Wagering Per Race Day | $3,327,547 | $2,445,002 | 36.10% |
| Average Purses Per Race Day | $250,768 | $254,301 | -1.39% |
* Includes worldwide commingled wagering on U.S. races.
