Handle, Number of Races Up in October


Thoroughbred racing last month experienced an increase in handle and the number of races compared to October 2019, according to economic indicators released by Equibase Nov. 4.
Wagering on U.S. races was up 19.7% to nearly $930 million while the number of races increased almost 3.6% to 2,852 for the month. The number of race days and amount of starts also had slight increases. This October had 340 race days, six more than last year, and there were 234 more starts compared to a year ago, totaling 22,410 starts last month.
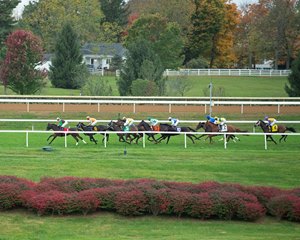
Major fall meets took place at Keeneland, Belmont Park, and Santa Anita Park during the month of October.
Keeneland (Oct. 2-24) reported an all-sources handle of $148,229,708 for 17 days of racing, down from 2019's $160,207,916 across the same number of days. The average daily handle was $8,719,395. The Lexington oval will host the Breeders' Cup World Championships Nov. 6-7.
The New York Racing Association announced that Belmont's meet (Sept. 18-Nov. 1) generated $9,923,813 in average daily all-sources handle, a 33.6% increase over the 2019 fall meet, and that despite running 10 fewer days than in 2019, all-sources handle of $267,942,961 was down just 2.5%.
Santa Anita (Sept. 25-Oct. 25) had to push the start of its autumn meet back a week due to the impact of the Bobcat fire on the air quality and surrounding community.
Racing has enjoyed the support from wagering thanks to advanced deposit wagering while many racetracks remained closed to fans due to the COVID-19 pandemic, but purses are still down as ADWs return a smaller percentage for purses than on-track wagering or simulcasting.
October purses of $90,845,317 are only down 1.2% compared to a year ago, but for year to date they are down nearly 27% to $720,074,376. The 2,849 race days in 2020 through October are about 26% less than at this point in 2019, and the 23,747 races are 24.1% less.
While average field size is still up 5.7% for the year, partly because of the amount of horses needing to race once tracks reopened after many shut down in the spring, average field size for October was down 2.4%.
|
October 2020 vs. October 2019 |
|||
|
Indicator |
October 2020 |
October 2019 |
% Change |
|
Wagering on U.S. Races* |
$929,063,211 |
$776,071,164 |
+19.71% |
|
U.S. Purses |
$90,845,317 |
$91,981,753 |
-1.24% |
|
U.S. Race Days |
340 |
334 |
+1.80% |
|
U.S. Races |
2,852 |
2,754 |
+3.56% |
|
U.S. Starts |
22,410 |
22,176 |
+1.06% |
|
Average Field Size |
7.86 |
8.05 |
-2.42% |
|
Average Wagering Per Race Day |
$2,732,539 |
$2,323,566 |
+17.60% |
|
Average Purses Per Race Day |
$267,192 |
$275,394 |
-2.98% |
|
YTD 2020 vs. YTD 2019 |
|||
|
Indicator |
YTD 2020 |
YTD 2019 |
% Change |
|
Wagering on U.S. Races* |
$9,277,878,319 |
$9,370,253,183 |
-0.99% |
|
U.S. Purses |
$720,074,376 |
$985,849,122 |
-26.96% |
|
U.S. Race Days |
2,849 |
3,849 |
-25.98% |
|
U.S. Races |
23,747 |
31,308 |
-24.15% |
|
U.S. Starts |
186,886 |
233,153 |
-19.84% |
|
Average Field Size |
7.87 |
7.45 |
+5.68% |
|
Average Wagering Per Race Day |
$3,256,539 |
$2,434,464 |
+33.77% |
|
Average Purses Per Race Day |
$252,746 |
$256,131 |
-1.32% |
| * Includes worldwide commingled wagering on U.S. races | |||
