Handle, Purses Fall in the U.S. in November
Image:

Description:
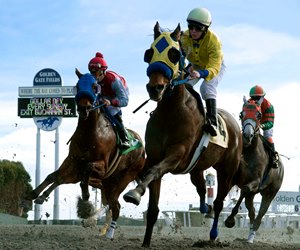
Photo: Vassar Photography
Racing at Golden Gate Fields did not take place over the second half of November after a COVID-19 outbreak there
U.S. betting handle in November fell more than 6.3% to $895.3 million and purses dropped nearly 20.5% to just shy of $92.1 million, according to figures released Dec. 4 by Equibase.
The drops were less significant than reductions to race dates and races, which fell 30.9% and 28.8%, respectively. Some tracks such as Golden Gate Fields and Zia Park were not in operation in late November due to the COVID-19 pandemic.
The Breeders' Cup World Championships took place in November at Keeneland without paid spectators, though thousands of horsemen, owners, industry leaders, and other guests were in attendance.
November's average field size was robust, up almost 4.4% to 8.35 starters per race, likely the result of less racing in the month and fewer racing options over the course of the COVID-19-altered year. The average purses per race day were up 15%.
Despite a shutdown of many tracks in the spring during the onset of the COVID-19 pandemic, yearly handle is only off 1.5% from the 2019 pace at $10.17 billion, compared to $10.32 billion in 2019 through November. Due to restricted or eliminated on-track attendance as a result of safety measures at many tracks, a higher percentage of handle this year has been generated from advance deposit wagering platforms.
Purses for the year are down 26.3%, nearly identical to the reduction in race dates. Races and starts are also down sharply.
The brightest economic indicator released Friday continues to be average wagering per day, which rose 35.5% in November and is up 33.8% on the year.
|
Thoroughbred Racing Economic Indicators
|
|||
|
For November 2020
|
|||
| November 2020 vs. November 2019 | |||
| Indicator | November 2020 | November 2019 | % Change |
| Wagering on U.S. Races* | $895,325,220 | $955,843,009 | -6.33% |
| U.S. Purses | $92,058,080 | $115,756,315 | -20.47% |
| U.S. Race Days | 224 | 324 | -30.86% |
| U.S. Races | 1,945 | 2,730 | -28.75% |
| U.S. Starts | 16,236 | 21,839 | -25.66% |
| Average Field Size | 8.35 | 8 | 4.35% |
| Average Wagering Per Race Day | $3,996,988 | $2,950,133 | 35.49% |
| Average Purses Per Race Day | $410,974 | $357,273 | 15.03% |
| YTD 2020 vs. YTD 2019 | |||
| Indicator | YTD 2020 | YTD 2019 | % Change |
| Wagering on U.S. Races* | $10,173,203,539 | $10,326,096,192 | -1.48% |
| U.S. Purses | $812,146,506 | $1,101,605,086 | -26.28% |
| U.S. Race Days | 3,073 | 4,173 | -26.36% |
| U.S. Races | 25,692 | 34,038 | -24.52% |
| U.S. Starts | 203,122 | 254,992 | -20.34% |
| Average Field Size | 7.91 | 7.49 | 5.54% |
| Average Wagering Per Race Day | $3,310,512 | $2,474,502 | 33.78% |
| Average Purses Per Race Day | $264,285 | $263,984 | 0.11% |
| * Includes worldwide commingled wagering on U.S. races. | |||