Economic Indicators: Strong Quarter for Purses, Handle
Image:
Description:
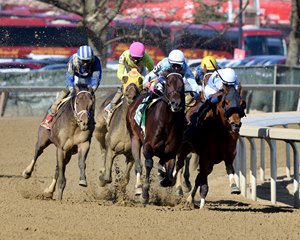
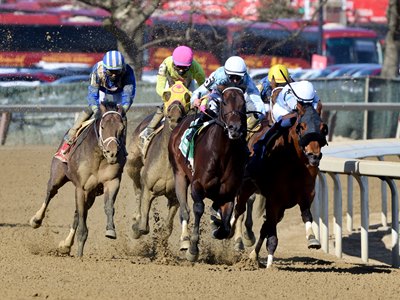
Photo: Coglianese Photos/Dom Napolitano
Horses turn for home at Aqueduct Racetrack
What a difference a year makes.
In March 2020 protocols to slow the spread of the emerging COVID-19 forced a virtual shutdown of racing but in March 2021 many tracks were beginning to see a return to some level of normalcy as many were beginning to allow the return of limited on-track crowds.
The different ends of that spectrum were reflected in positive trends in racing's handle and purses for the first quarter when compared with the first quarter of 2020 as noted in Thoroughbred racing's economic indicators released April 5 by Equibase.
Handle for the first three months of 2021 improved 10.27% to $2,766,096,277, while purses were up 4.76% to $214,998,406. Surprisingly, following the shutdowns in March 2020, the number of race days in the first quarter of 2021 were down 3.4% to 766.
Considering the decline in race days, the uptick in purses for the first quarter is even more impressive. Average purses per race day improved 8.45% to $280,677 in the quarter.
With a different world this March, as compared with March 2020, wagering was up 32.01% for the month to $965,796,545—a more than $234 million gain in handle. Purses improved 46.66% for the month to $81,797,768 fueled by a 36.45% increase in race days to 292.
In trends likely attributable to more tracks coming back online, in March average field size declined 2.56% to 7.59 horses per race and average wagering per race day was off 3.25% to $3,307,522.
|
Thoroughbred Racing Economic Indicators
For March and First Quarter 2021 |
|||
| March 2021 vs. March 2020 | |||
|
Indicator |
March 2021 |
March 2020 |
% Change |
|
Wagering on U.S. Races* |
$965,796,545 |
$731,609,777 |
+32.01% |
|
U.S. Purses |
$81,797,768 |
$55,774,436 |
+46.66% |
|
U.S. Race Days |
292 |
214 |
+36.45% |
|
U.S. Races |
2,563 |
1,787 |
+43.42% |
|
U.S. Starts |
19,452 |
13,919 |
+39.75% |
|
Average Field Size |
7.59 |
7.79 |
-2.56% |
|
Average Wagering Per Race Day |
$3,307,522 |
$3,418,737 |
-3.25% |
|
Average Purses Per Race Day |
$280,129 |
$260,628 |
+7.48% |
|
1st QTR 2021 vs. 1st QTR 2020 |
|||
|
Indicator |
1st QTR 2021 |
1st QTR 2020 |
% Change |
|
Wagering on U.S. Races* |
$2,766,096,277 |
$2,508,529,406 |
+10.27% |
|
U.S. Purses |
$214,998,406 |
$205,227,651 |
+4.76% |
|
U.S. Race Days |
766 |
793 |
-3.40% |
|
U.S. Races |
6,702 |
6,616 |
+1.30% |
|
U.S. Starts |
52,211 |
51,973 |
+0.46% |
|
Average Field Size |
7.79 |
7.86 |
-0.83% |
|
Average Wagering Per Race Day |
$3,611,092 |
$3,163,341 |
+14.15% |
|
Average Purses Per Race Day |
$280,677 |
$258,799 |
+8.45% |
* Includes worldwide commingled wagering on U.S. races.