Turfway Park Spurs U.S. First Quarter Purse Increase
Image:
Description:
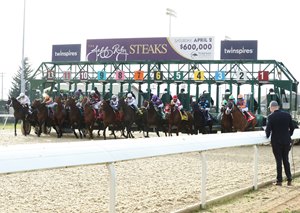
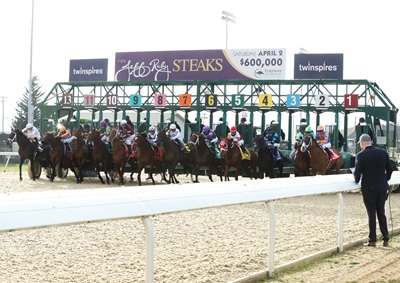
Photo: Coady Photography
Jeff Ruby Steaks Day served up six stakes races at Turfway Park
A racing friend of mine called me March 31 to note the impressive race card Turfway Park put together for its showcase date, Jeff Ruby Steaks Day, April 2. We lamented the fact that as frontside construction continues, fans would not be able to attend the day that included six stakes races.
Yes, Turfway is again capturing the attention of fans, who should be able to return to the Northern Kentucky track later this year as the new grandstand is scheduled to be completed Sept. 1.
Even without fans the first three months of this year, Turfway caught horsemen's attention with purses that more than doubled. That increase helped lead the way to a 13.84% increase in United States purses for the first quarter of 2022 compared with the first quarter of 2021.
Fueled by the addition of a nearby historical horse racing gaming venue (an on-track venue will open later this year), Turfway purses increased from $6,104,572 for its Jan. 1-March 27 dates in 2021 to $12,907,734 for its Jan. 1-April 2 dates in 2022. While some of that increase of more than $6.8 million is not included in the Thoroughbred Racing Economic Indicators for the first quarter of U.S. racing in 2022, it still represents a large chunk of the increase of more than $30 million for purses compared with the first quarter of 2021.
The other big factor spurring the jump in purses is a 5.35% increase in race days as the racing schedule gets back to pre-COVID-19 standards. The 807 race days offered in the first quarter of 2022 still trail the 844 dates offered in the first quarter of 2019.
Wagering for the first quarter was up 1.09% to more than $2.79 billion.
One metric of concern is that the average wagering per race day declined 4.04% to $3,465,130. That drop is likely attributable to the 3% decline in field size from 7.79 horses per race in the first quarter of 2021 to 7.56 for the first quarter of 2022.
Studies have documented that the increased wagering interests provided in larger fields lead to increased handle. The industry has faced challenges in maintaining field size because of declining foal crops and horses starting fewer times. Thus, when there is an increase in race days—like the one registered in the first quarter of 2022—it can be a challenge to maintain field size.
From 2011-21 average field size for North American races declined 8.2% from 8.04 to 7.38. During that same time, the average starts per horse declined 4% from 6.2 to 5.95. The U.S. foal crop declined 21% from 22,653 in 2011 to an estimated 17,840 for 2021.
|
1st QTR 2022 vs. 1st QTR 2021 |
||||
|
Indicator |
1st QTR 2022 |
1st QTR 2021 |
% Change |
|
|
Wagering on U.S. Races* |
$2,796,360,290 |
$2,766,166,337 |
+1.09% |
|
|
U.S. Purses |
$244,753,188 |
$214,998,157 |
+13.84% |
|
|
U.S. Race Days |
807 |
766 |
+5.35% |
|
|
U.S. Races |
6,768 |
6,702 |
+0.98% |
|
|
U.S. Starts |
51,146 |
52,211 |
-2.04% |
|
|
Average Field Size |
7.56 |
7.79 |
-3.00% |
|
|
Average Wagering Per Race Day |
$3,465,130 |
$3,611,183 |
-4.04% |
|
|
Average Purses Per Race Day |
$303,288 |
$280,676 |
+8.06% |
|
| * Includes worldwide commingled wagering on U.S. races. | ||||