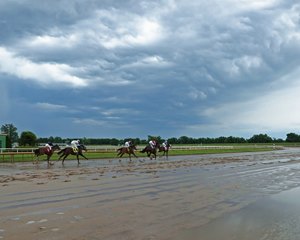
Analysis: Fatality Rates Not Higher on 'Off' Tracks


The incidences of catastrophic racing injuries is not more likely to occur on a wet or "off" track on both dirt or turf surfaces, according to an analysis of statistics compiled in the Equine Injury Database and released Sept. 20 by The Jockey Club.
An analysis of musculoskeletal-related fatalities between Jan. 1, 2021, and Dec. 31, 2022, showed a 1.36 per 1,000 starts fatality rate on a fast track. During this same period, the rate on a "good" track was 1.72, on a "muddy" track was 1.23, and 1.44 on a "sloppy" track. Tracks labeled "wet fast" had the lowest fatality rate at 1.18. Horses whose deaths were categorized as "sudden deaths," which often can be attributed to clearly defined causes, where not included in this analysis.
For turf races, the fatality rate on firm going was 1.12 per 1,000 starts. Courses labeled "good" had a 0.72 rate and "yielding" conditions produced a 1.28 rate. No fatalities were reported for 175 races run on "soft" conditions.
"For the two years of data studied—2021 and 2022—there were no statistically-significant differences in incidence of fatality found to be associated with track condition on either dirt or turf surface types," stated the conclusion of the analysis, which was requested by Thoroughbred Daily News.
Surface condition at the time of a racing fatality has been recorded since the Equine Injury Database started in 2009. The recently released fatality rates were compiled for the last two years because that time frame was requested. Shannon Luce, director of communications for The Jockey Club, said looking at trends over a longer period of time by track condition is coming.
Thirty-two Thoroughbred tracks allow their fatality rates to be published online. Rates are available for at least nine different subcategories: Age (2, 3, and 4+), Surface (turf, dirt, and synthetic), and Distance (less than six furlongs, 6-7 1/2 furlongs, and eight furlongs and up). Luce said there is not a plan to add surface condition to the individual racetrack results.
Luce said EID analysts would follow up on a BloodHorse request to look at fatality rates by track condition by quarter to see how racing at different times of the year might influence the effect of surface and track conditions on fatality rates.
The analysis of racing fatalities based on surface and track conditions for 2021 and 2022 can be viewed on the Equine Injury Database website.
The Equine Injury Database, conceived at the Grayson-Jockey Club Research Foundation's first Welfare and Safety of the Racehorse Summit, was launched by The Jockey Club in July 2008 and seeks to identify the frequencies, types, and outcomes of racing injuries using a standardized format that generates valid statistics, identifies markers for horses at increased risk of injury, and serves as a data source for research directed at improving safety and preventing injuries.
| EID Racing Fatalities by Surface and Track Condition Analysis | ||||
| The table below shows the number of race starts on Dirt, number of fatalities, and fatalities per 1,000 starts (incidence) for each track condition recorded in the EID. The 95% confidence interval of the incidence is also shown. There were no statistically-significant differences in the incidences associated with different track conditions. | ||||
| Dirt | ||||
| Track Condition | Starts | Fatalities | Fatalities per 1,000 Starts |
95% Confidence Interval |
| Fast | 308,954 | 419 | 1.36 | 1.23-1.49 |
| Frozen | 29 | 0 | 0 | 0-116.97 |
| Good | 22,147 | 38 | 1.72 | 1.25-2.35 |
| Heavy | 95 | 0 | 0 | 0-38.87 |
| Muddy | 17,936 | 22 | 1.23 | 0.81-1.86 |
| Sloppy | 25,085 | 36 | 1.44 | 1.04-1.99 |
| Slow | 58 | 0 | 0 | 0-62.12 |
| Wet Fast | 2,541 | 3 | 1.18 | 0.4-3.47 |
| Turf | ||||
| Track Condition | Starts | Fatalities | Fatalities per 1,000 Starts |
95% Confidence Interval |
| Firm | 81,434 | 91 | 1.12 | 0.91-1.37 |
| Good | 12,542 | 9 | 0.72 | 0.38-1.36 |
| Soft | 175 | 0 | 0 | 0-21.48 |
| Yielding | 1,567 | 2 | 1.28 | 0.35-4.64 |
