Belmont Stakes Winners as Sires
We now come to the somewhat widely held hypothesis that winners of the Belmont Stakes (gr. I) are not taken as seriously as potential commercial stallions as those that have won either the Kentucky Derby Presented by Yum! Brands (gr. I) or Preakness Stakes (gr. I), or both.
When exploring the reasoning behind this “hypothesis,” one often comes up with a variety of excuses that usually can be summed up as either “not as much speed as needed in the other two races,” or “the pedigree says distance.” We know both explanations are full of holes.
We decided to look for hints in the biomechanical make-up of the Belmont winners since 1976. We selected that year for two reasons: a) 40 years serves as a good generational arc, and b) the 1977 winner was Triple Crown winner Seattle Slew—a parlay that extended the influence of Bold Ruler through Seattle Slew’s grandsire Boldnesian. (Seattle Slew went on to sire two Belmont winners in Swale and A.P. Indy while Bold Ruler’s son Secretariat sired Risen Star and his grandson Cannonade sired Caveat.)
We added some other parameters to the study, eliminating winners since 2010 because they have not had enough crops to prove themselves, those that were exported before establishing themselves or died early. The filly Rags to Riches did not make the cut. That brought our test group to 25 stallions for whom we had corresponding biomechanical data—more than 30 physical measurements and various probabilities generated by our growth curve algorithms.
We also compiled the same data for Kentucky Derby and Preakness winners during the same period. Then we took the 25 leading sires of 2015 and ran them through the same tests. What we discovered was what has been essentially true since equine biomechanics started in the 1940s: The stallion’s phenotype has a great deal to do with his ability to sire quality on a consistent basis.
“Whoa! Say what?”
Phenotype.
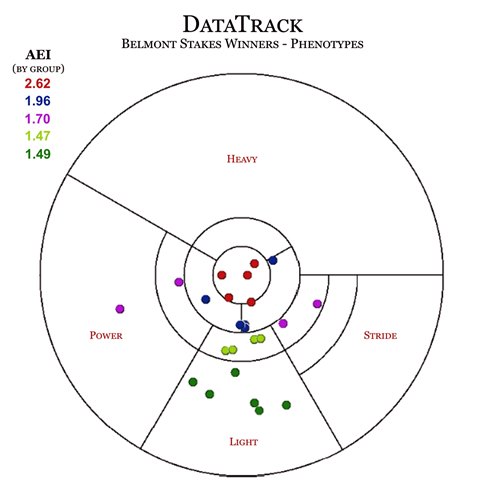
Certain measurements were taken to determine how a horse is balanced in terms of power, stride elements, and body weight (aka trunk size). Power is needed to generate speed, efficient stride is needed to cover a distance of ground, and the right amount of body weight is needed to process the energy required to make that horse successful.
Our program plots horses as young as 16 months old on a Phenotype Target (shown), which tells whether that horse is adequately balanced (center of the target) or has more Power (P to the left) than Stride elements (to the right), or too much body weight (top) or not enough (bottom). The closer a horse is plotted to the center the more balanced it is, and the more consistent it is projected to be as both a runner and a sire or broodmare.

Across a wide spectrum that has decades of data to support it, horses with light body weight can often be good racehorses over a distance. However, they are also the poorest producers, along with those too heavy because they pass on their characteristics.
Our challenge was to find a standard to use to judge if this historic evidence was true for Belmont winners, as well as for those from the other groups.
Fortunately, that standard is at hand: Average-Earnings Index (AEI). The phenotype target shows where the winners of the Belmont are plotted. They are also color-coded to reflect the average AEI of all of them in that sector. As the numbers show, the stallions that are grouped closer to the center have an average AEI that is up to 43% higher than those with lighter body weight.
