Keys to Finding Value Horses at Santa Anita
Image:
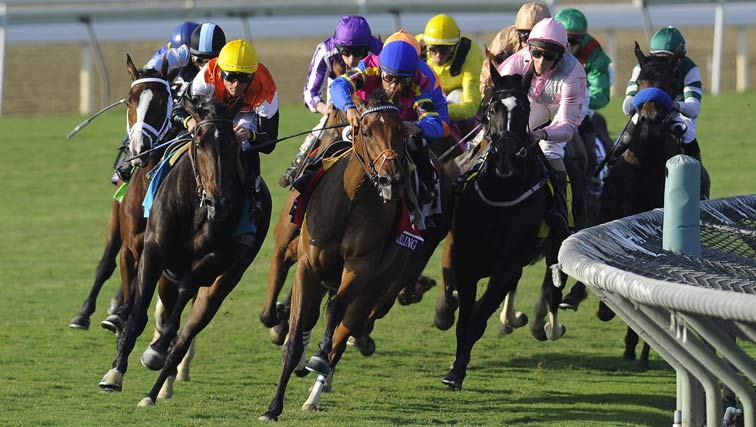
Description:
Photo of turf racing at Santa Anita Park by Eclipse Sportswire
Look at it this way, if you had three stocks that you were considering investing in and the long-range performance and future prospects of each was almost identical, but one of the three paid a 3.75% dividend and the other two paid a 2.25% dividend, the choice would be easy.
Well, believe it or not there are very obvious standards that a bettor can begin with that do not take in-depth study and will automatically isolate in their favor certain “types” of races that should provide higher returns for the same amount of wager placed.
Since the Santa Anita Park fall race meet begins on Sept. 26, I am going to take you through the steps I use for one of the many standards that is crucial to forming a handicapping worksheet for any of my covered racetracks.
This particular exercise is one of the first steps I always take in order to assign value to certain “types” of races based on long-term, large-number samples.
In this case, I have gone to the charts of races run at Santa Anita Park during the most recent spring meet and broken those races down into four categories:
1. Dirt sprints (everything less than one mile).
2. Dirt routes (one mile and longer).
3. Turf sprints (everything less than one mile).
4. Turf routes (one mile or longer).
For purposes of value, I begin by calculating the average number of horses that run in each of the four designated race types, the average mutuel winning payoff, the number of favorites that win and the number of favorites that finish on the board (second or third) and the number of favorites that finish off the board. As you’ll see, these categories are a vital piece of my overall approach.
Below are the results taken from the most recent meet run at Santa Anita using the final 10 weeks that ran from April 25 to closing day on June 29. First, we’ll take a look at the numbers and then I’ll give you an idea of what they mean.
DIRT SPRINTS - 141 RACES
Average Number of Starters: 7.7
Average Win Mutuel: $10.70
Winning Favorites: 49 (34.7%)
Favorites 2nd or 3rd: 45
Favorites Off the Board: 47
DIRT ROUTES - 58 RACES
Average Number of Starters: 6.6
Average Win Mutuel: $10.17
Winning Favorites: 25 (43.1%)
Favorites 2nd or 3rd: 18
Favorites Off the Board: 15
TURF SPRINTS - 48 RACES
Average Number of Starters: 8.2
Average Win Mutuel: $14.02
Winning Favorites: 13 (27.1%)
Favorites 2nd or 3rd: 14
Favorites Off the Board: 21
TURF ROUTES - 87 RACES
Average Number of Starters: 8.0
Average Win Mutuel: $12.80
Winning Favorites: 24 (27.6%)
Favorites 2nd or 3rd: 38
Favorites Off the Board: 25
Now that you have those numbers it is important to keep in mind that my goal is to not only find winners, but more importantly find value so that I can create the best Return On Investment (ROI).
Clearly, if a bettor is influenced by or feels more comfortable following the public and backing favorites there is no disputing that bettors had a higher percentage of winners betting the dirt races than they did the turf races, 34.7% and 43.1% for the former as opposed to 27.1% and 27.6% for the latter.
But percentage of winners doesn’t come close to telling the story. Take a look at the difference between the dirt sprints and the turf sprints.
First, let’s go back to the percentage of favorites winning the type of race. The dirt sprints are won by 34.7% of the favorites while the turf sprints are won by 27.1% of favorites. That is a success rate difference of 7.6%. However, had you bet every favorite in the dirt sprint races, your average ROI for a $2 wager (based on the total returned from the 49 winners) would have been $1.66.
Using that same formula, a $2 wager on every favorite in the turf sprint would have returned a slightly less average ROI of $1.57 for every $2 wager. But from an investment standpoint v. percentage of winning standpoint that ROI for a $2 wager would have been 4.5% less (the nine cents based on $2 or 4.5% of $1) which means that v. the 7.6% higher winning percentage is in actuality a 3.1% favorable margin with the turf sprinter.
I know this can sound a bit confusing but each of these factors is part of the overall value assessment. I invite you to ask any serious money manager how much a 3.1% margin means in any endeavor, and you’ll get an idea of why this way of getting to the true value of any race is essential.
And, keep in mind you already know that in betting a turf sprint at Santa Anita your overall payoff price on the winner is already providing you with a 38% advantage in the payoff if you compare the $12.02 profit from the average turf sprint payoff of $14.02 measured against the $8.70 profit from the $10.70 dirt sprint payoff.
There are many other ways to show you the value of looking much more favorably on turf sprints and turf distance races at Santa Anita. I’ll leave you with just one more. After all, I don’t want to give away everything.
Taking into consideration field size and how that impacts the handicapping process we can simply measure the average number of horses per race against the mutuel price and see the advantage.
In the dirt sprint you divide 7.7 into 10.70 and you get a factor of 1.4
In the turf sprint you divide 8.2 into 14.02 and you get a factor of 1.7
In the dirt route you divide 6.6 into 10.17 and you get a factor of 1.5
In the turf route you divide 8.0 into 12.80 and you get a factor of 1.6
As I said, there is so much more. But when Santa Anita opens on Sept. 26, I would suggest that you take a long, hard look at the turf races before you do the dirt races.
Until next time, good luck and we’ll see you at the windows.