Inside the Trip: Updating Woodbine Jockey Efficiency Ratings
Image:
Description:
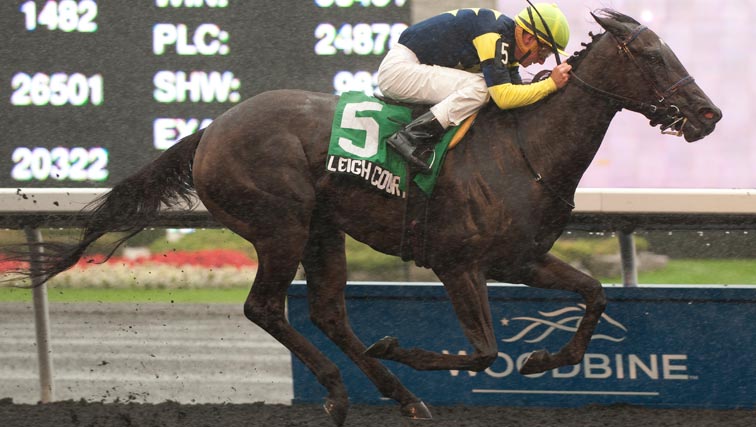
Jockey Gary Boulanger, above guiding Leigh Court to victory in the La Lorgnette Stakes, has been extremely efficient since his return to competitive race riding. (Photo by Michael Burns/WEG)
There is no doubting that Todd Pletcher is bound for the Hall of Fame just as soon as he is eligible. With overwhelming success at the top level of American racing, Pletcher’s starters have earned more than $275-million from more than 3,600 wins. With just shy of 16,000 starters going to post in Pletcher’s name, his strike rate is an enviable 22-percent.
On Aug. 10, 2014, Pletcher debuted Miss Always Ready in a Saratoga maiden race for juvenile fillies at 1 1/16 miles on the turf. The filly is a full sister to Breeders’ Cup Juvenile Fillies Turf winner More Than Real, a debut winner on the turf at Saratoga at 1 1/16 miles.
Miss Always Ready was sent off as a 2-1 favorite against 10 rivals in this debut race.
In the paddock, analyst Maggie Wolfendale noted that Miss Always Ready was equipped with blinkers, something she indicated was fairly rare for Pletcher-trained first-time starters. Planning to bet this race, and hearing Wolfendale’s analysis, I launched a window with the Daily Racing Form’s Formulator product.
Obviously, Pletcher first-time starters are well-regarded. As of the running of this particular race, over the last five years, Formulator identified Pletcher debuters as 128 from 474, a 27% strike rate, with 56% of them landing in the first three.
Over the last five years, Pletcher-trained first timers starting at a mile or more were 23 for 125, an 18% strike rate. Only 36 total first-time starters debuted with blinkers, but nine of them were winners, a cool win percentage of 25%.
But combine some of the elements, and the powerful Pletcher barn looked to have a rare weak spot - 2-year-old debuters on turf, wearing blinkers. Pletcher trainees were winless over the last five years with those characteristics, 0-for-8. While it is a small sample size, it still seems fairly odd to find a trainer so successful, especially overall with his 2-year-old first-time starters, to have such a poor record with those wearing blinkers on grass. Only one starter was second, two finished third. The average beaten margin of the nine horses was nearly 11 ½ lengths.
Within about three minutes, this incredibly narrow metric gave me confidence to play against Miss Always Ready. It had nothing to do with the filly, but everything to do with analysis that goes well beyond “traditional” form.
As for Miss Always Ready, she finished ninth of ten, beaten more than nine lengths.
Products like that offered by Formulator are superb when it comes to dissecting a trainer’s performance. Why don’t we know more, and have more tools, to analyze jockey performance?
Outside of the most rudimentary statistics, advanced data on jockey performance is quite limited. That which is readily available highlights performance with a particular trainer or strike rate on a surface or at a distance. But what about how they actually ride? The Trakus Jockey Efficiency Ratings (JERs) have been the first truly quantitative foray into the discussion. First introduced at Woodbine in 2012, Trakus is publishing an updated version, and in so doing, offering the largest sample-size in the history of the JERs.
From the beginning of the 2011 season through the end of August 2014, Trakus recorded data from 994 races and more than 8,200 starters in races at 1 1/16 miles on the Polytrack. The average ground horses run from each post position is gathered. At Woodbine, horses drawn in gate one covered, on average, 5,672 feet. Horses drawn in gate 12 covered 5,722 feet. That difference of 50 feet suggests that horses starting from gate 12 in these races travel, on average, about 5 ¾ lengths more than horses starting from gate one.
The mounts of each jockey are then sorted and compared with the average that would be expected from their starting gate. In the most extreme example, if a jockey had all mounts starting from gate 12, their performances would only be compared with those who started from the same gate.
Let’s say Jockey X had one mount start from gate 12 and covered 5,712 feet. Since the average is 5,722, that particular ride would be characterized as a -10 (5,712 minus the average 5,722). All of those differences are then averaged over the entire period of time studied.
Below, you will find the data for the 21 currently active jockeys at Woodbine who had at least 100 mounts at the distance during the time period studied. Negative JERs represent ground-saving, while positive JERs represent jockeys whose mounts cover more ground than average. The $2 ROI, average odds, and average finish position for all mounts studied also are included.
Gary Boulanger returned to riding in 2013 after nearly eight years away from the saddle. Recovering over that period from a devastating fall at Gulfstream Park, Boulanger is back and in remarkable top form. The native of Alberta earned as much in 2013 from 66 wins in 615 mounts as he did from 238 wins out of 1,492 rides in 1995.
As Boulanger was returning to action at Woodbine, Canada’s National Post profiled the courageous return.
“Everything happens for a reason,” Mr. Boulanger says. “Why did the accident in 2005 happen? I don’t know. Did it make me stronger? I don’t know.
“But it made me feel that this was what I truly was supposed to do in life, and so why not pursue what you feel in your heart to be right?”
It will not be easy. The former ace jockey isn’t exactly a nobody in the sport, but the horse racing business is all about showing me now — not telling me about what you did way back when.
Boulanger sure is showing it. In the updated Woodbine Jockey Efficiency Ratings, the biggest ground saver in the colony is the feisty veteran. On average, Boulanger’s mounts save 12.36 feet per start in races at 1 1/16 miles. That converts to roughly 1.5 lengths of ground-saving compared with the average from all gates. The much-accomplished Eurico Rosa Da Silva is next amongst the winningest jockeys saving the most ground, at 7.36 feet per mount, with Justin Stein close behind, saving 6.47 feet per race.
On the flip side, three of the most successful riders at Woodbine are also three of the widest riders. Patrick Husbands checks in as the least efficient, with mounts averaging 8.82 feet of extra ground per race. Luis Contreras comes next at 6.88 with Emma-Jayne Wilson after that at 4.33. At the most extreme, covering an extra 8.82 feet suggests the mounts of Patrick Husbands travel just over a length more than the averages dictate in each race.
Put another way, riding Gary Boulanger over Patrick Husbands means, on average, you would expect Boulanger’s mount to cover 2.5 lengths less than the mount of Husbands.
“My biggest thought in the process of coming back was just letting people see me ride, that I was the same person everyone remembered before the accident,” Boulanger said.
“Saving ground wins races. I’ve ridden that way from a young age after watching guys like Eddie Delahoussaye and Laffit Pincay. Save ground and make your move at the right time. Now, it’s just subconscious to me, automatically there.
“Saving ground is saving lengths. If the margin at the finish is a head or a nose, and my horse wins, it’s probably because I saved it earlier in the race.”
But Boulanger fully recognizes the individual needs of his horses, having tried his hand as a trainer in the years before returning to race riding.
“We had a filly I trained, Spring a Latch, that was always showing speed in races and the jocks were coming back saying they just couldn’t get her to rate.
“She kept showing speed in all her races, and she was getting leg weary at the end and not winning. It was frustrating to watch. I was on her every morning and she rated behind horses just fine for me. Finally, we found someone who could, and she actually won her first race for us coming from last in a two-turn race – so much for her being a runaway sprinter.”
Some horses are better off kept in the clear. Some need cover or else they won’t settle. Take away the individual qualities some horses may exhibit that require a certain type of ride, and the JERs provide insight to a fuller body of jockey performance.
Does Boulanger’s place at the top of the JERs make him the best rider? Hardly, and this report doesn’t suggest it.
Is it indicative of a jockey who is keenly aware of his surroundings and what it might take to win? That seems a more logical conclusion.
“I look at the form and know the pace scenario and try to identify if I need to be in the clear or behind horses. It’s something I’ve always analyzed. Not every race falls the way it’s supposed to and you could end up needing to make a quick adjustment. Being able to do that could even be the biggest factor in race riding.”
While it is incredibly difficult to have a positive $2 ROI from the sample of races studied, only four of 21 did, and they were just negligibly positive, comparing the efficiency stature of the rider with the quality of horses they rode makes for compelling reading.
Boulanger’s mounts were sent to post at an average of 13-1 odds, while second-place finisher Sheena Ryan was a bigger 20-1, and Tommy Wong was at 32-1. The average finishing position for a horse in the study, ridden by Boulanger, was 4.83. For Ryan, the average finishing spot was 5.35, while Wong’s average mount was a 6.14.
So how can one truly glean meaningful data from the Woodbine JERs?
The data is part and parcel of a much bigger picture, and individual race dynamics still dictate much about the result of a race. If you were considering betting a horse drawn in gate 11 with a wider-riding jockey and hoped there would have a chance to save ground, it is now easier to recognize that said jockey is not particularly attuned to saving ground.
Conversely, if you are hoping to get a longshot into the trifecta and superfecta that is partnered by a jockey particularly adroit at saving ground, the data can at least identify those most aware of their riding style.
For specific race-by-race Trakus-collected data from Woodbine, visit the Trakus Charts on its website.