Second Quarter Purses Up, Wagering Still Down
Image:

Description:
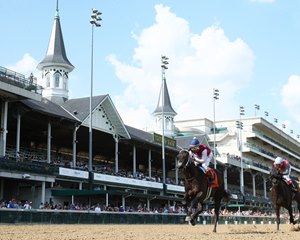
Photo: Coady Photography
Churchill Downs' new gaming facility is responsible for the lion's share of higher purses paid by U.S. racetracks during the second quarter of the year
The collective performance of U.S. Thoroughbred racetracks during the second quarter of the year proved to be a mixed bag.
On the positive side, purses grew more than 9% and average purses paid per race day increased more than 5% from April through June, according to figures released by Equibase. The downside is that wagering fell 3% during the same period.
The pattern of higher purses and lower wagering has been largely consistent whether the comparison is with the month of June, the second quarter, or year-to-date statistics with same periods of 2018.
Churchill Downs was responsible for the lion's share of the purse growth during the second quarter, which increased more than $26.6 million nationwide. The Louisville, Ky., track paid a record $32.2 million in purses during its April 27-June 20 spring meet—nearly $10 million more than the 2018 spring meet. Driving the growth is Churchill Downs' $65 million historical racing facility named Derby City Gaming that opened in September.
"We've improved our state's valuable horse racing and agriculture industry with lucrative rewards for horsemen," said Kevin Flanery, president of Churchill Downs Racetrack. "The result was a thriving and ultra-competitive racing product with more entries and high-quality horses that appealed to bettors and horse players nationwide."
Gaming continues to be a key driver of purse growth for U.S. tracks. For the month of June, the states paying more to horsemen and owners are all beneficiaries of casino gaming. Besides Kentucky, higher total purses paid for June were reported for Maryland, Ohio, and Pennsylvania. New York reported a slight decline in total purses but also ran nearly 9% fewer races, which resulted in a 9.25% increase in average purses per race day.
California did its best to right the ship in June. Statewide, the tracks paid 11.5% less in purses but also raced 15.7% fewer days, which produced a slight 1.13% increase in average purses per race day to $235,091.
Handle took a substantial hit during the first quarter largely because of the troubles at Santa Anita Park, where a rash of breakdowns led to a temporary shutdown of racing March 9-28 and the cancellation of three graded stakes for 3-year-olds. Total U.S. wagering during the first quarter dropped 3.49%.
If there is a silver lining to lower second quarter wagering numbers, it is that the decline has slowed from the first quarter to essentially 3%. Year to date, the decline in total wagering is 3.22%.
The total number of race days is up for the second quarter and year to date. Second quarter race meets collectively reported a 2.19% increase in number of race days, and total days year to date is up slightly more than 1% to 2,104. The higher number of days and depressed total wagering resulted in lower average wagering per race day, which dropped nearly 5.1% to $2,492,640 for the second quarter and 4.28% to $2,697,576 year to date.
|
Thoroughbred Racing Economic Indicators
|
|||
|
June 2019, Second Quarter
|
|||
|
June 2019 vs. June 2018 |
|||
|
Indicator |
June 2019 |
June 2018 |
% Change |
|
Wagering on U.S. Races* |
$991,001,055 |
$1,065,526,949 |
-6.99% |
|
U.S. Purses |
$115,188,334 |
$110,050,928 |
+4.67% |
|
U.S. Race Days |
499 |
499 |
0% |
|
U.S. Races |
3,905 |
3,958 |
-1.34% |
|
U.S. Starts |
27,726 |
29,008 |
-4.42% |
|
Average Field Size |
7.10 |
7.33 |
-2.02% |
|
Average Wagering Per Race Day |
$1,985,974 |
$2,135,325 |
-6.99% |
|
Average Purses Per Race Day |
$230,838 |
$220,543 |
+4.67% |
|
2nd Qtr 2019 vs. 2nd Qtr 2018 |
|||
|
Indicator |
2nd Qtr 2019 |
2nd Qtr 2018 |
% Change |
|
Wagering on U.S. Races* |
$3,140,726,476 |
$3,238,194,342 |
-3.01% |
|
U.S. Purses |
$316,859,797 |
$290,247,705 |
+9.17% |
|
U.S. Race Days |
1,260 |
1,233 |
+2.19% |
|
U.S. Races |
10,167 |
10,098 |
+0.68% |
|
U.S. Starts |
73,409 |
74,926 |
-2.02% |
|
Average Field Size |
7.22 |
7.42 |
-2.69% |
|
Average Wagering Per Race Day |
$2,492,640 |
$2,626,273 |
-5.09% |
|
Average Purses Per Race Day |
$251,476 |
$235,400 |
+6.83% |
|
YTD 2019 vs. YTD 2018 |
|||
|
Indicator |
YTD 2019 |
YTD 2018 |
% Change |
|
Wagering on U.S. Races* |
$5,675,700,071 |
$5,864,821,854 |
-3.22% |
|
U.S. Purses |
$543,979,337 |
$515,570,620 |
+5.51% |
|
U.S. Race Days |
2,104 |
2,081 |
+1.11% |
|
U.S. Races |
17,457 |
17,396 |
+0.35% |
|
U.S. Starts |
130,239 |
132,746 |
-1.89% |
|
Average Field Size |
7.46 |
7.63 |
-2.23% |
|
Average Wagering Per Race Day |
$2,697,576 |
$2,818,271 |
-4.28% |
|
Average Purses Per Race Day |
$258,545 |
$247,751 |
+4.36% |
| * Source: Equibase. Includes worldwide commingled wagering on U.S. races. | |||